The GIL
Python has a global lock that has to be accessed by the current running thread as the interpreter is not fully thread safe. This is called the GIL or Global Interpreter Lock.
Since Python 3.13, the core developers of Python have been working on a free-thread implementation of Python interpreter as part of PEP-703 . With the release of Python 3.14, the objectives of this PEP has advanced further, with the free-threaded mode getting more enhancements.
Building Python without GIL
On Windows and Mac operating systems, one can download Python 3.14 without the GIL directly from the download page for the release.
On Linux, one needs to build this from source code with the --disable-gil option. For example, here I am building installing this on my laptop to the /opt folder.
$./configure --disable-gil --prefix=/opt && make -j16 && sudo make install
...
Once the build and install is complete, you get an executable named python-3.14t at the prefix. The t here stands for the free-threading build which is what the GIL disabled Python executable is called.
$ which python3.14t
/opt/bin/python3.14t
$ python3.14t
Python 3.14.0 free-threading build (tags/v3.14.0:ebf955df7a8, Oct 20 2025, 10:22:44) [GCC 12.2.0] on linux
Type "help", "copyright", "credits" or "license" for more information.
>>>
One can use sysconfig.get_config_var() to check for a GIL disabled build.
>>> import sysconfig
>>> if sysconfig.get_config_var("Py_GIL_DISABLED"):
...     print('GIL is disabled')
...
GIL is disabled
The time command
When you run a command prefixed with the Unix time utility, you get three measurements:
$ time sleep 5

real    0m5.008s
user    0m0.003s
sys     0m0.000s
These three numbers represent different views of how time was spent:
real- This is the wall-clock time - the total elapsed time from start to finish as seen by a human with a stopwatch.user- This is the total amount of CPU time spent executing the program's user-space codesys- This is the amount of CPU time spent executing kernel-space operations on behalf of the command - e.g., system calls, I/O, thread scheduling, etc.
Let us look at some common patterns of these times.
| SL | Pattern | What It Indicates | Interpretation |
|---|---|---|---|
| 1 | real ≈ user | CPU-bound, single-threaded workload | The program runs on one CPU core only. Common for GIL-bound Python programs or any non-parallel CPU-heavy task. |
| 2 | user >> real | Parallel or multi-core scaling | Total CPU time (user) is sum of all threads/processes across cores. Indicates true CPU-level parallelism. For example, user ≈ 4 × real means effective use of ~4 CPUs. |
| 3 | user << real | I/O-bound or waiting workload | The program spends most time waiting — on disk, network, sleep calls, or locks. CPU is mostly idle; wall-clock time (real) grows while CPU time remains low. |
The following image explains this a bit more.
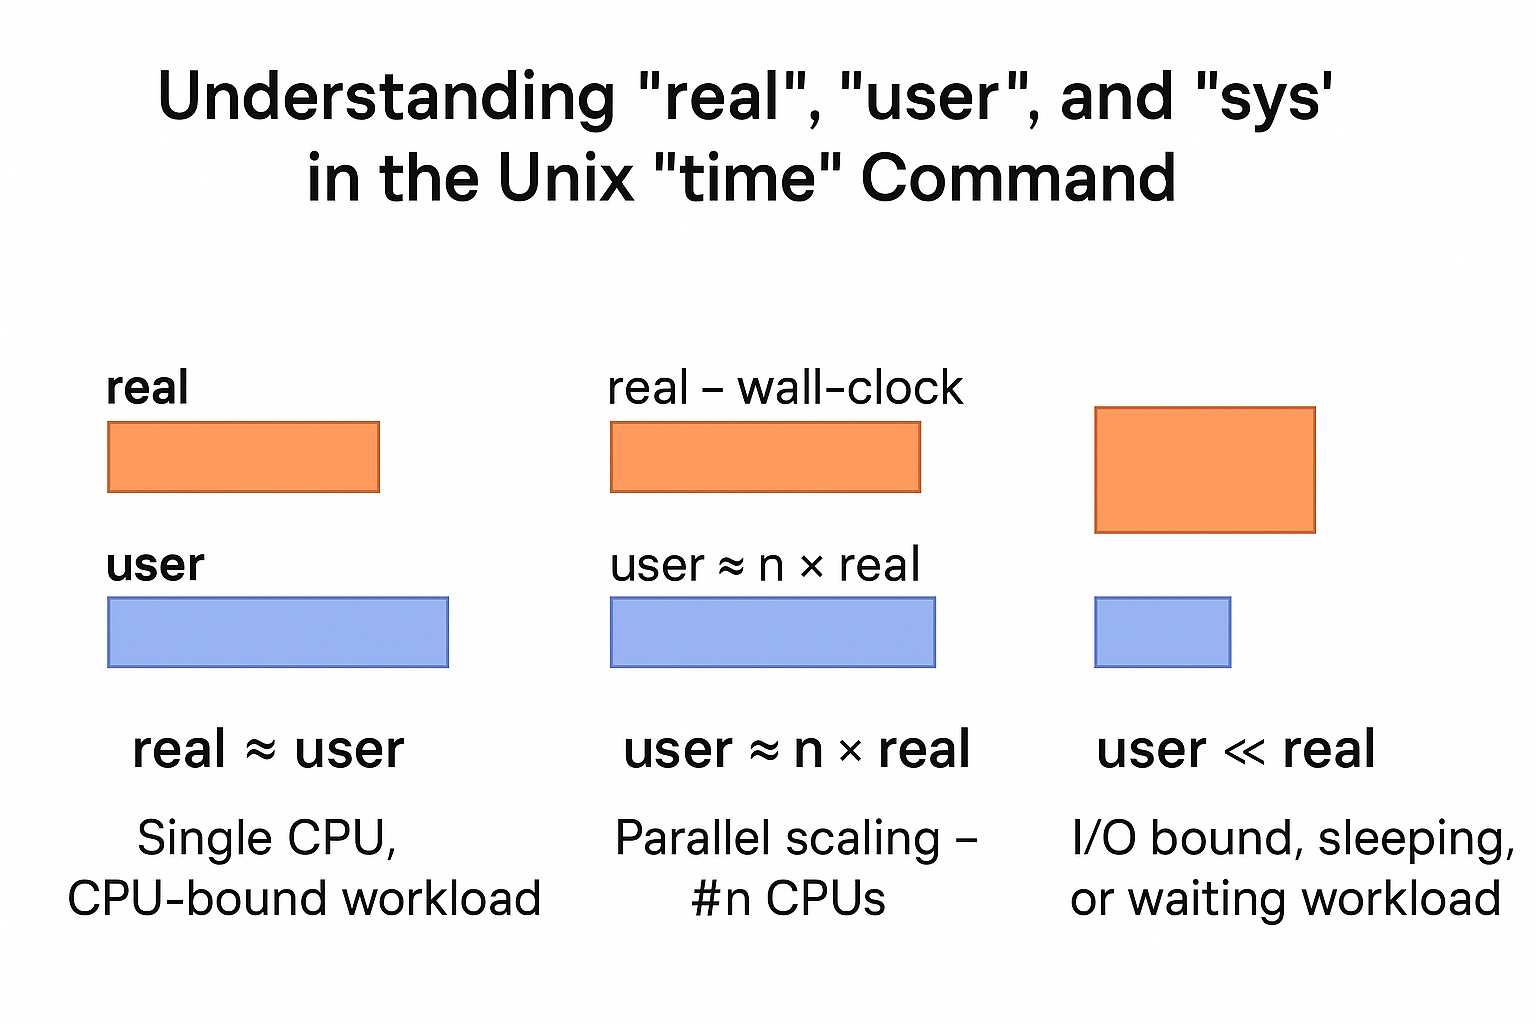
In the simple example above, the only thing the code did was sleep - with no time being spent on user or kernel space logic so you see the real time as 5 seconds and the other two as trivial (zero).
Python - GIL vs no-GIL Performance
For comparing Python 3.14 with GIL vs no-GIL on my system I installed two versions of it - one a normal build at /usr/local/ prefix and the other the free thread build at /opt as shown above.
I then created two separate virtual environments - named py314_gil and py314_nogil using these two Python runtimes respectively.
We will use a couple of examples to see the performance of free-threaded version of Python 3.14 against the standard version.
Primality Checker
The first example is a multithreaded prime checker with zero optimizations.
import threading
from queue import Queue, Empty

def is_prime(n):
    """ Check for input number primality """

    # A very basic primality checker with
    # no optimizations
    for i in range(3, int(n**0.5+1), 2):
        if n % i == 0:
            return False

    return True

class PrimeChecker(threading.Thread):
    """ Thread class for primality checking """

    def __init__(self, queue):
        self.queue = queue
        self.flag = True
        threading.Thread.__init__(self)

    def run(self):

        while self.flag:
            try:
                n = self.queue.get(timeout=1)
                is_prime(n)
            except Empty:
                break

    def stop(self):
        """ Stop the thread """

        self.flag = False

if __name__ == "__main__":
    numbers = [1297337, 1116281, 104395303,
               472882027, 533000389, 817504243,
               982451653, 112272535095293,
               115280095190773, 1099726899285419]*100
    q = Queue(1000)

    for n in numbers:
        q.put(n)

    threads = []
    for i in range(4):
        t = PrimeChecker(q)
        threads.append(t)
        t.start()

    for t in threads:
        t.join()
The code creates an array of 10 rather large prime numbers and multiplies the array with 100 to create an array of 1000 prime numbers. I have predefined the numbers for the code to run as a benchmark with repeatable timings - and to avoid the overhead of creating large random prime numbers.
The numbers are pushed to a queue. A set of four PrimeChecker threads are run which pop numbers from the queue and check for primality. The threads stop when the queue is empty.
Since we use the square root operation, the code becomes CPU bound and hence GIL plays a major role.
We will run this as,
$ time python prime_checker.py
Python 3.14 - regular (GIL bound)
Running this on the regular Python virtual environment,
(py314_gil) $ time python prime_checker.py

real    1m39.169s
user    1m38.499s
sys     0m0.808s
From the earlier description of the time command, you can see this falls in pattern #1 with the code running on just one CPU. The scalability is restricted by GIL and the usage of 4 threads has no effect at all. It effectively runs on a single CPU.
Python 3.14 - free-threaded (no GIL)
Running the same code on the no-GIL virtual environment,
(py314_nogil) $ time python prime_checker.py

real    0m11.755s
user    0m42.719s
sys     0m0.008s
This falls in the pattern #2 with the user time >> real time. You can also see,
real/user = 42.7/11.8 = 3.6 ≈ 4.0
We are running four threads and now the program is properly scaling to 4 CPUs!
So the free-threaded version does seem to eliminate the GIL in this specific example.
You can try modifying the code to run as many threads as possible - with the maximum value limited by the number of CPU cores. My laptop has a 16 core CPU, so when I launch 16 threads and run the same code, I get,
(py314_nogil) $ time python prime_checker.py

real    0m6.414s
user    1m23.886s
sys     0m0.048s
You can quickly verify the scaling by checking that user/real in this case is approx 13 ~ 14, i.e pretty close to 16. Note that scaling is never exact but it will be close to the actual number of threads.
The actual numbers will vary depending on your system but the same pattern can be found.
Matrix Multiplication
The following code creates random matrices of a fixed size using Python lists and multiplies them row by row. Matrix multiplication is a process that can be done concurrently since each row can be multiplied in parallel and the results assembled to the final matrix.
In this specific example we are creating 200x200 square matrices. Note the use of the concurrent.futures library instead of the threading library.
import random
from concurrent.futures import ThreadPoolExecutor

def generate_matrix(n, m):
    return [[random.randint(1, 10) for _ in range(m)] for _ in range(n)]

def multiply_row(i, A, B):
    """Compute one row of the result matrix C."""

    row_result = []
    for j in range(len(B[0])):
        s = 0
        for k in range(len(B)):
            s += A[i][k] * B[k][j]
        row_result.append(s)
    return (i, row_result)

def matmul_threaded(A, B, num_threads=4):
    """
    Multiply two matrices using threads.
    """

    n = len(A)
    C = [None] * n

    with ThreadPoolExecutor(max_workers=num_threads) as executor:
        futures = [executor.submit(multiply_row, i, A, B) for i in range(n)]
        for f in futures:
            i, row = f.result()
            C[i] = row
    return C


if __name__ == "__main__":
    N = 200
    for i in range(100):
        A = generate_matrix(N, N)
        B = generate_matrix(N, N)
        result = matmul_threaded(A, B)
Python 3.14 - regular
Let us look at the output in regular Python.
(py314_gil) $ time python matrix_multiply.py

real    1m7.987s
user    1m8.297s
sys     0m0.663s
The real time equalling user time indicates that this is stuck computing on a single CPU core.
Python 3.14 - no-GIL
(py314_nogil) $ time python matrix_multiply.py

real    0m17.243s
user    0m59.013s
sys     0m0.682s
The pattern here (user >> real) indicates CPU scalability and the scaling is,
user/real = 59/17 = 3.47 ≈ 4.0
The code is again circumventing GIL and scaling concurrently to 4 CPUs. Try adjusting the number of threads launched and check the results.
Where no-GIL Python doesn't benefit
The new free threading model definitely improves performance for CPU bound code with threads as we have seen so far. However for concurrent I/O bound code the behavior is more nuanced.
Let us consider this simple concurrent URL fetcher with threads.
from concurrent.futures import ThreadPoolExecutor
import requests

def fetch_url(url):
    """ Fetch a URL and return its data """

    try:
        return requests.get(url, timeout=10).content
    except Exception:
        pass


if __name__ == "__main__":
    urls = ['https://www.reddit.com',
            'https://google.com',
            'https://example.com',
            'https://facebook.com',
            'https://apple.com']*100

    count = 0
    with ThreadPoolExecutor(max_workers=4) as executor:
        futures = [executor.submit(fetch_url, url) for url in urls]
        for f in futures:
            data = f.result()
            if data is not None:
                count += 1
    print(f'{count} urls returned data')
I have run this under the GIL and no-GIL virtual environments a few times.
For a proper comparison, I am only including the value for the runs that successfully returned alll data - i.e those that say "500 urls returned data".
| Run | GIL | No GIL | ||
|---|---|---|---|---|
| real | user | real | user | |
| 1 | 111 | 40 | 122 | 37 |
| 2 | 116 | 38 | 122 | 34 |
| 3 | 120 | 37 | 124 | 38 |
| 4 | 115 | 34 | 124 | 37 |
| 5 | 123 | 37 | 109 | 37 |
| Mean | 117 | 37 | 120 | 37 |
You can observe that the no-GIL version on average performed worse than the GIL version of Python!
Except for one outlier that had the smallest time of all at 109s, the no-GIL version consistently had the worse times. Why does this happen ?
One clue is in the consistent time taken for the user times. The code spends most of its time on network I/O and has nearly zero CPU bound code, so it doesn't get any advantage from the GIL free Python in terms of the ability to scale to multiple CPU cores.
In GIL-free Python all threads truly run concurrently on multiple CPU cores. However this adds more fine-grained locks, atomic operations and reference counting, adding non-trivial synchronization overhead - which is cheaper in regular Python because most of it is taken care by the GIL.
Also in regular Python, I/O operation are already GIL free since the GIL is released around I/O blocks.
Hence you see the rather counterintuitive behavior of the GIL free Python performing worse than regular Python in this case.